|
Motion toolbox is a package for recording and analysing human movement. A QuickTime video of the movement is recorded to hard disk, and the position of reflective markers on the joints of the subject digitised. These coordinates are then used to calculate the joint angles, velocities, and accelerations, which are then in tum input to an inverse dynamics model of the body to yield the joint moments and powers.A tool palette allows the user to select commonly used biomechanical measurements and display them underneath the video, so facilitating a full kinematic and kinetic understanding of the motion. This combination provides an exploratory interface so that the user (teacher, student or clinician) can interactively compare and contrast the biomechanics of a variety of movements, including pathological conditions such as stroke, amputation, cerebral palsy, and arthritis. It is anticipated that the package will be of interest to therapists and clinicians working in the fields of rehabilitation, orthopaedics and sport.
Kinematics refers to the positions of the various body segments and joints as they move with time, including their linear and angular velocities. Kinetics refers to the forces, moments (torques) and powers responsible for the motion. These latter variables can be estimated from the kinematics by a process known as inverse dynamics, in which a mathematical model of the limb is derived according to the simple laws of mechanics (Newton-Euler equations). The kinetic variables are extremely useful because they describe what is happening in the muscles to cause the motion observed, descriptions which are not possible with the human eye alone.
Unfortunately, until now the equipment required for this type of analysis has been expensive - of the order of $A100,000. This factor has tended to limit the application of this technology to centres of excellence and research institutions. The use of such equipment is also time consuming and difficult, usually requiring trained personnel for operation.
Recent advances in multimedia technology have provided an excellent opportunity to provide an inexpensive and simple means of motion analysis. The Motion toolbox described in this paper is suitable for use by busy professionals in the clinic or gymnasium. Motion toolbox is also a teaching resource for exploring human movement, and will be of interest to researchers in the field of human movement and biomechanics.
The video signal is converted into a digital, QuickTime format and recorded on the hard disk of a computer. In our case, a Power Macintosh 7100AV computer was selected as a device for recording motion, because it was capable of a frame rate of 25 pictures per second, a rate which has been shown to be adequate for recording human motion (Winter, 1982).
The Motion toolbox package can then be used to digitise each frame of the motion, to calculate the various kinematic and kinetic variables. A second function of the Motion toolbox is to analyse the biomechanics of the motion.
The multimedia scripting language SuperCard (Allegiant Technologies, Inc., San Diego, CA) was used to develop the Motion toolbox.
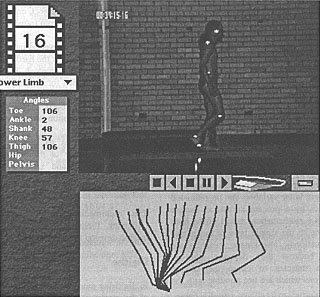
Figure 1: Digitising mode
As the markers are digitised, a stick figure is drawn beneath and the various angles calculated by trigonometry.
Once the positions of the various markers have been recorded, the program automatically uses these to calculate (by trigonometry) the joint angles of the body in each picture, the linear velocities and accelerations of the body segments and the angular velocities and accelerations of the segments and joints. These are then used to calculate the joint kinetics (forces, moments and powers) by the method of inverse dynamics (Bresler & Frankel, 1950).
This process relies on some assumptions about the body: that the joints are frictionless pin joints, the limb segments are rigid bodies, and that the motion is planar, The mass and centres of gravity and moments of inertia of the limb segments must also be known, and these are computed with reference to standard tables derived from cadaver studies (Clauser, et al, 1969) or stereophotogrammetry (Zatsiorski & Seluyanov, 1983). Low pass filtering of the data is necessary to remove high frequency artefacts from the digitisation process (caused by slight movements of the markers on the skin or imprecise manual identification), and this done using a fourth order digital filter with a cut off frequency of 6 Hz. Forward and backward passes are made to eliminate phase shifts.
One of the key reasons why we chose to develop Motion toolbox was the possibility of displaying the motion through digital video at the same time as viewing the graphs. It is difficult fro students and practitioners to interpret the graphs without seeing the actual motion at the same time. An interface, shown in Figure 2, was therefore designed in which the QuickTime video is displayed above a set of graph axes. A control palette made up of a set of buttons (at right in Fig 2) allows the user to choose the graphs of the required quantities to be drawn. As the user scrolls through the video with the standard video controller provided, the grey bar moves across the graph, highlighting which part of the graph corresponds to which part of the motion (see Fig. 2). Thus, the user is provided with a concrete, visual connection between abstract mechanical information and the real physical world.
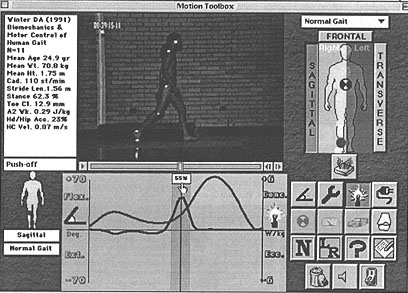
Figure 2: Analyse mode
On this screen the knee joint angle and ankle joint power are being compared. The subject
is currently in the push off phase of the walking cycle (55% of cycle time).
Depending on the data which is digitised, it is possible to view the data from either the left or right side of the body, or indeed from the front. The joint for which data is required is chosen by clicking at appropriate positions on the body at the top right of the screen in Fig. 2.
A range of tools are provided on the palette to display appropriate variables. Variables currently available for display are: joint angle, ground reaction forces, joint moment, joint power, electromyography, marker position, joint angular velocity, joint angular acceleration, and joint compressive force.
Up to two separate graphs can be displayed at the same time to compare different aspects of the motion. For any digitised subject it is possible to superimpose the relevant graph for normal motion onto any chosen graph. In this way, the clinician can identify any weaknesses or abnormalities in the motion.
A library of common movements is available for study as part of the program. An example of the gait of a below knee amputee is shown in Fig. 4. Other available library movements are: slow and fast walking, above knee amputee, cerebral palsy (diplegia) and throwing.
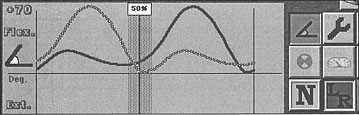
Figure 3: The L-R function
This uses Hypergraph to plot the data for both sides simultaneously. In the example shown, the right
knee has just completed its swing phase flexion, whilst the left is about to begin its flexion.
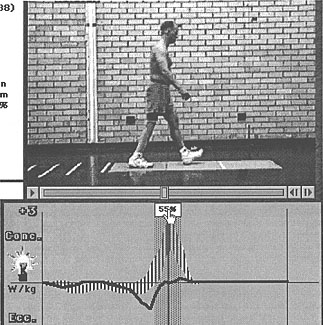
Figure 4: Several library examples of commonly encountered motions are included in the package. Here,
a below knee amputee's ankle power is being examined, with data for a normal individual superimposed.
The SuperCard X-function HyperGraph (Boojum Computer Systems, Inc.) has been utilised to plot the graphs from files of data derived from the digitisation process. This powerful routine enables almost instantaneous spline smoothed plotting, with autoscaling and labelling. For example, the user might want to examine both sides of the body at the same time. This can be done by pressing the appropriate button, which calls HyperGraph to suitably rearrange the data and plot both curves on the same axis.
Voice and balloon help is available at all times to guide the user or student through the process of digitisation, and to help explain the biomechanical terminology used. As shown in Figure 5, interactive annotations are given on the complex calculations required to calculate some of the biomechanical variables. Figure 6, on the other hand, shows a short tutorial pointing out salient events occurring in key frames of the video of the motion. In this way, the program can be used for learning in addition to being a tool for the analysis of motion.
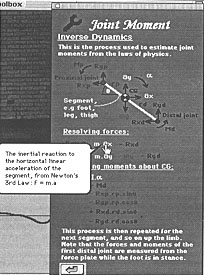
Figure 5: The balloon help facility
In this case, the rather complex calculations used to derive the joint
moments (inverse dynamics) are annotated interactively.
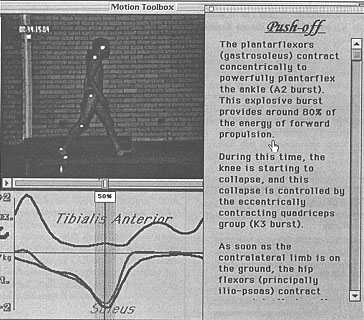
Figure 6: The help facility
When the button denoting the present phase of the movement (in this case "push off") is
pressed, a short tutorial pointing out the salient events of that frame appears.
A further limitation at present is the necessity for manual digitising of marker coordinates. There are several possible methods available to automate this process: the markers could be identified by the user and their trajectories then followed by a semiautomatic process (as is commonly used in commercial motion analysis equipment), or alternatively, coloured markers could be tracked by scanning the colour of each pixel in the video image. Eventually, it may be possible to track the image of the limb itself by a combination of spline methods and stochastic filtering as is presently being used for 3D mouse and low bandwidth video conferencing applications (Blake & Isard, 1994).
Clauser, C. E., McConville, L. T. & Young, L. W. (1969).Weight, volume and center of mass of segments of the human body. AMRL-Technical Report 60-70, Wright-Patterson Air Force Base, OH.
Bresler, B. & Frankel, L. P. (1950). The forces and moments in the leg during level walking. Trans. American Society of Mechanical Engineers, 72, 27-36.
Zatziorski, V. & Seluyanov V. (1983). The mass and inertia characteristics of the main segments of the human body. In Matsui H. & Kabayashi K. (Eds), Biomechanics VIII-B, 1152-1159. Human Kinetics, Champaign, IL.
| Authors: Chris Kirtley MB ChB, PhD School of Physiotherapy c.kirtley@curtin.edu.au
Rob Phillips PhD
Curtin University of Technology Please cite as: Kirtley, C. and Phillips, R. (1996). Motion toolbox: An interactive multimedia package for studying human movement. In C. McBeath and R. Atkinson (Eds), Proceedings of the Third International Interactive Multimedia Symposium, 197-202. Perth, Western Australia, 21-25 January. Promaco Conventions. http://www.aset.org.au/confs/iims/1996/ek/kirtley.html |