[ IIMS 96 contents ]
Haematology tutorial
Robyn Devenish, Robert Oostryck and Rod Kevill
Curtin University of Technology
Introduction
For the student of Haematology the ability to correctly identify normal and abnormal blood cells is an essential skill. To interpret the morphological changes and variations that occur in diseases of the blood and arrive at a clinical diagnosis is very difficult and conventionally takes many hours of study using a microscope. In a haematological disease such as Chronic Myeloid Leukaemia, for example, the morphology of the white blood cells changes dramatically as precursor cells normally found only in the bone marrow enter the peripheral blood stream (see Fig. 1). At the present time the only meaningful way a student can learn to identify these cells is to have one to one tutorial help at the microscope.
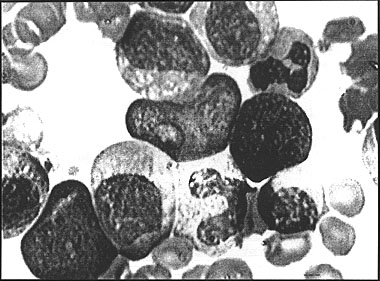
Figure 1: Chronic myeloid leukemia
Background
At Curtin University of Technology in the School of Biomedical Sciences, Haematology is taught to students enrolled in the Medical Science degree course. There are -
- 80 first years
- 60 second years
- 30 third years (major Haematology unit)
These students have access to only 20 microscopes and very little tutorial time. A major problem for the students was finding extra time when the microscopes were not in use, to study their blood cell morphology. It became apparent that a solution to this problem could be met by the use of the capabilities of interactive computer based multimedia.
Student survey
Before embarking on such a project a survey of second and third year students was performed to assess the extent of the problem. Following is a summary of some of the survey questions:
Do you find the class tutors' help with cell identification satisfactory?
- YES - 56%
- NO - 44%
- Not enough time - too many students
- Too shy to ask questions
- Just wasting tutors time
- Just guess at odd cells
- Don't understand initial concepts
When you have finished assessing a blood film do you have difficulty in forming a conclusion?
- NO - 20%
- YES - 80%
- Not enough time
- Miss an important cell or inclusion
- More than one abnormality
- Can't relate abnormality to the disease
Do you have difficulty in relating and interpreting blood count results/histograms from automated cell counters, to the morphology on the blood film?
What do you perceive as the major difficulties in cell identification?
- Not enough time with tutor
- Abnormal white blood cells and precursors
- Atlas doesn't have full lineage
- Variations of normal and abnormal cells
Do you find tutorials using the video helpful?
- YES - 99%
- Get feedback on what we were supposed to see
- Reinforcement
- Clarify cell morphology
- What cells are significant
- Much better to "see" than be told
- NO
- One person too shy to ask questions
Although the video tutorials were deemed most useful, sometimes a period of 1 to 2 weeks elapsed before the student could get this type of feedback on their interpretation of the blood cell morphology.
Interactive multimedia as a solution
- The student would not need access to a microscope. The student would not need a tutor as immediate on screen help with cell identification and access to the correct diagnosis would be available. The student could work at own pace. Other information could be incorporated, such as a fully illustrated patient history, further laboratory test results, normal values and a glossary.
- The student's progress could be monitored either in a learning mode or in an assessment mode.
- Initially, only one blood film per case study would be required to digitise the blood cell images onto the computer. This would be a major advantage in gaining access to rare blood cell disorders.
Current methods of teaching
Currently students are given a report sheet with a brief patient history, blood count values and a stained blood film (see Fig. 2).
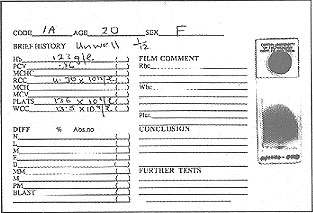
Figure 2: Report sheet and blood film
The blood film is assessed, using a microscope and the student performs a differential white blood cell count, using a "diff. counter". This involves counting 100 white blood cells and differentiating them into their different cell types (see Fig. 3). After also examining the red blood cells and platelets the student is expected to write up a conclusion and suggest a diagnosis. This may include suggesting further laboratory tests to aid their diagnosis.
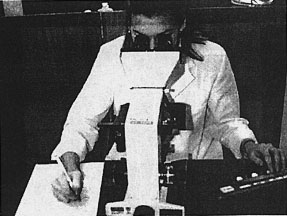
Figure 3: Using a "diff" counter at the microscope
New proposals using interactive multimedia
It was decided to enhance the educational value of the teaching material by using realistic haematological case studies, as seen in a clinical laboratory, rather than just an "atlas" type package. At the present stage of development, the program includes the following features:
- The patient history includes "hot text" with which the student can interact and actually see the features and clinical appearance of the patient (see Fig. 4).
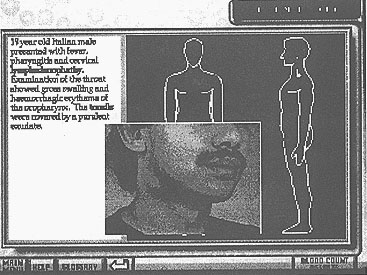
Figure 4: The patient history screen
- A glossary is also available on every screen for the student to access the meaning of unfamiliar terms or abbreviations (see Fig. 5).
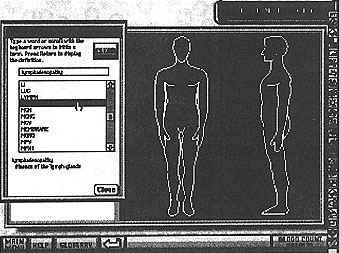
Figure 5: The patient history screen with glossary displayed
- Full blood count results from printouts (see Fig. 6) from automated haematology analysers (see Fig. 7) were obtained and scanned using a Umax Vista-S8 flatbed scanner. The student is then be able to interact with these results and learn to relate the appearance of the graphical representation of the cells with the microscopic appearance (see Fig. 8).
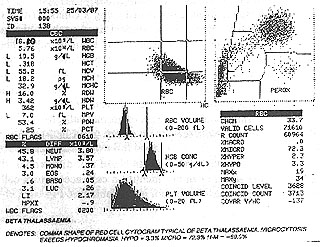
Figure 6: Printout of full blood count results
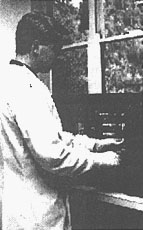
Figure 7: Haematology analyser
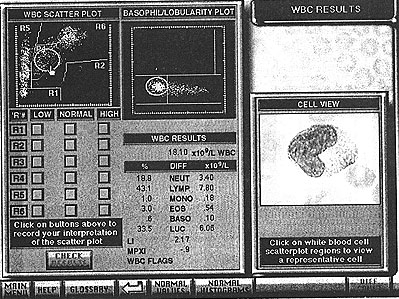
Figure 8: White blood cell results screen showing a "hot spot"
- On appropriate screens the student has access to normal values or images of normal cells, to compare with the patient results (see Fig. 9).
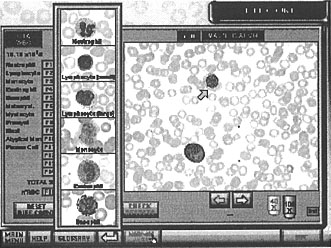
Figure 9: The differential count screen with normal cells displayed
- At any stage in the white blood cell differential, if the student can not identify a cell, access to a cell identification protocol is available (see Fig. 10).
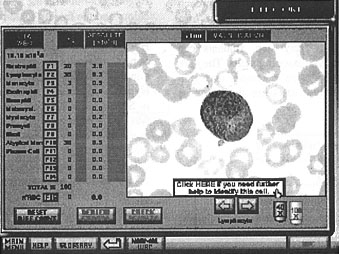
Figure 10: The differential count screen with access to the cell identification protocol
- The cell identification protocol has a step by step interactive approach to the identification of each white blood cell whereby the student must select specific morphological criteria to identify the cell. As on other screens, access to the correct answers is always available (see Fig. 11).
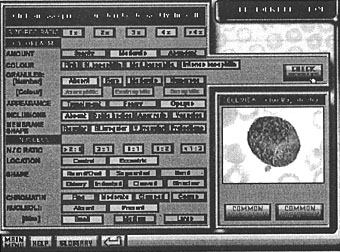
Figure 11: The cell identification protocol screen
- The correlation between the red blood cell morphology and the graphical representation from automated haematology analysers also allows for student interactivity, to enable a better understanding of these concepts For example, screens are available for red blood cell results, with an overlay of normal histograms, and for platelet morphology.
- In most haematological case studies, to come to a final diagnosis, confirmatory tests are often requested. Again by interactivity, the student can suggest tests they want ordered and have immediate feedback as to the results.
In summary, this is a totally new and unique approach to teaching haematology. By working at their own pace, with the high degree of screen interaction and tutorial help available at every step, students can develop their own deductive reasoning skills. They are also able to reach a conclusive diagnosis and gain confidence in their ability to correctly diagnose haematological diseases.
Development
Initially 6 months was spent in designing the storyboards. It was decided to incorporate the conventional method of examining a blood film and therefore the navigation is fairly structured, with the interactivity occurring within each screen. By nature the diagnosis of any clinical disease state has to be approached in a systematic fashion. For haematological disease the protocol shown above is generally accepted (Dacie & Lewis, 1995).
This format was adopted in the designing of the storyboards.
Authoring environment
The Haematology Tutorial was developed in SuperCard 2.0, an environment very similar to HyperCard, but with the addition of built in 8 bit (256) colour and the facility to add scripts to graphic objects. The scripting language SuperTalk is a super-set of HyperTalk, and the conversion of HyperCard stacks to SuperCard stacks is provided within SuperCard. Some minor "tweaking" may be necessary with some HyperCard commands which are not directly supported in SuperCard. The most critical aspect of this project was the requirement to display digitised images of blood cells on the computer screen equal in quality to that seen through a microscope. This meant that 16 bit colour (32768 colours) was the minimum in terms of colour quality, and that colour balance and image density had to be accurate and consistent over the 500 images captured and processed for each case study.
Early prototyping revealed that the QuickTime video format would provide the required image quality in the SuperCard environment, and at the same time allow transparent compression-decompression and rapid retrieval of the images. A decision was made to purchase a high resolution triple CCD video camera to ensure optimum colour fidelity and balance at a sufficient resolution. The camera was adapted to fit an Olympus BH-2 microscope, and the images were digitised through a Power Macintosh 7100 AV computer (see Fig. 12), supplied through a local Apple University Development Fund grant.
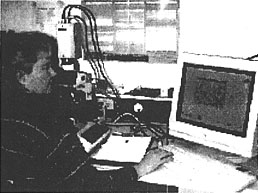
Figure 12: Capturing the blood cell images
Image processing
Images were captured in two magnifications from the microscope. The "low power" views were captured with a 40x objective and the "high power" views were captured using a 100x objective with oil immersion. The standard Macintosh AV program, Video Monitor was used to capture the images as PAL "half screen" (376 x 288 pixels) single frame PICT files, which were then manipulated with Adobe PhotoShop to produce a set of base images ready for conversion to QuickTime format. Images are displayed in the program in two sizes: 376 x 288 pixels and 188 x 144 pixels. The larger half screen size is used for the differential count (see Fig. 10), and for red blood cell and platelet morphology screens. The smaller size appears in other screens as a cropped area without any scaling (see Fig. 11).
Program design and structure
The Case Study module of the Haematology Tutorial program is essentially data driven. It is designed as a series of template screens on which different images and data relating to each case study is presented to the student. The selection of the particular case study may be decided by the student or may be selected, either sequentially or randomly, by the program itself, depending on the mode required.
An important part of the design was to enable the program to be used in "author" mode to generate or modify and save case study data without the necessity for a programmer. For example, the Cell Identification screen (see Fig. 11) requires the student to select characteristics describing the displayed cell, and then to cheek their identification. In author mode, the same screen can be used to select the correct characteristics (with alternative selections) and save this data to the case study data file. The program may then be switched immediately to "student" mode to check the data from the student perspective.
Other screens may be used in author mode to position screen "hotspots" and link these to images (see Fig. 8), enter patient history information and data (see Fig. 4), or even proceed through a complete differential count on screen (see Fig. 10) and save the results in the data file. The main advantages of the author mode is that additional case studies may be created without technical programming assistance, and case study data may be verified and/or modified while the subject expert works through the program.
Programming considerations
An initial prototype of the differential count used a database of screen coordinate hotspots for each cell in the particular frame being displayed. As the mouse was passed over the cell, the cursor changed to a "magnifying glass" icon to indicate a high power view was available for this cell. Similarly, in the high power view, when the mouse was waved over a cell, the cursor would change to a "question mark" icon to indicate a link to the Cell Identification protocol screen. This method was effective in terms of the interaction, but presented difficulties with the complexity and amount of data required for implementation. A further problem with this method was that the program was unable to determine in a multiple cell view, exactly which cell the student was considering when they pressed an F-Key to identify and count the cell. A possible solution was to have the student click on the particular cell first, then press an F-Key to count the cell. A cell selected in this manner could not be highlighted by an overlay of a graphic, since the QuickTime display occupied the highest layer on screen, apart from the cursor.
A different approach simplified the data structures and decreased the program's response time. A small arrow was overlayed onto each frame in the sequence to indicate to the student the current cell under consideration. Frames with multiple cells were simply duplicated and the arrow moved to a different cell in each duplicated frame. This meant that there was one frame for each cell in the blood film regardless of multiple cell views. The student could now view the frame and press an F-Key to identify the cell indicated by the small arrow (see Fig. 9). Pressing any F-Key also automatically advanced the view to the next frame, saving a number of keystrokes. The high power view was now achieved by clicking on a "x100" icon, and in the resulting high power view, a panel appeared with the message "Click here if you need further help to identify this cell", which linked to the Cell Identification protocol (see Fig. 10). The Review Errors procedure was also vastly simplified by this technique. In this mode, the program could easily locate incorrectly identified cells, and display these sequentially for the student to review. A displayed countdown of the number of incorrect cells left was also now possible.
References
Dacie, J. & Lewis, S. (1995). Practical Haematology. Chapter 7 - Blood cell morphology in health and disease. 8th Ed. pp 132-135, Churchill Livingstone.
Acknowledgments
This project was made possible by two grants from the Committee for the Advancement of University Teaching (CAUT); one in 1995, and one in 1996 for Stage 2 development. The graphic design was by Jud Kieran, honours student, School of Design, Curtin University of Technology, and Bayer Diagnostics kindly permitted the use of printouts from the Technicon I instrument.
Authors: Robyn Devenish and Robert Oostryck, Biomedical Sciences
Rod Kevill, Educational Computing Services
Curtin University of Technology
Perth, Western Australia
Please cite as: Devenish, R., Oostryck, R. and Kevill, R. (1996). Haematology tutorial. In C. McBeath and R. Atkinson (Eds), Proceedings of the Third International Interactive Multimedia Symposium, 99-106. Perth, Western Australia, 21-25 January. Promaco Conventions.
http://www.aset.org.au/confs/iims/1996/ad/devenish.html
|
[ IIMS 96 contents ]
[ IIMS Main ]
[ ASET home ]
This URL: http://www.aset.org.au/confs/iims/1996/ad/devenish.html
© 1996 Promaco Conventions. Reproduced by permission. Last revision: 14 Jan 2004. Editor: Roger Atkinson
Previous URL 23 Nov 2000 to 30 Sep 2002: http://cleo.murdoch.edu.au/gen/aset/confs/iims/96/ad/devenish.html