The new generation graphing calculator and its application in the mathematics classroom
John GreenUniversity of Southern Queensland

The new generation graphing calculator and its application in the mathematics classroomJohn GreenUniversity of Southern Queensland |  |
In 1985 Casio was credited with inventing the first graphing calculator which had a significant impact on the teaching and learning of mathematics in many Australian schools. Now just a little over a decade later we see the first of a new generation of graphing calculators enter the market. It is called the TI-92 (by Texas Instruments) and contains many of the features that are normally only found on a computer. A more detailed investigation reveals that it is much more a computer than a graphing calculator and is capable of being used to carry out mathematical investigations that until now required the use of expensive laptops and even more expensive software. As devices like these become increasingly more available and affordable the implications for the teaching and learning of mathematics are profound.In this paper (and conference demonstration) I will use the TI-92 to focus on the use of such technology as a teacher's aid, a personal teaching assistant for the teacher and a personal learning assistant for the student. I will use specific examples to illustrate how such technology might be used to illuminate particular mathematical concepts and enhance the teaching and learning of these. This paper and demonstration will be of particular interest to teachers of mathematics in the middle to upper years of high school and will be of interest also to teacher educators in the same area.
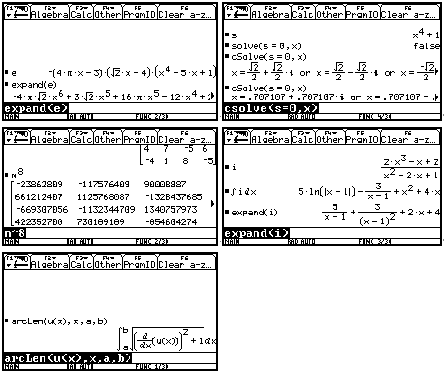
Figure 1: Symbolic manipulator in action
Figure 1 illustrates how expressions may be expanded or equations solved at the touch of a button. Sophisticated functions whose integrals would have previously taken a considerable amount of time to calculate can now be evaluated on the TI-92 in seconds. Students need no longer labour over lengthy matrix computations. The TI-92 comes equipped with a handy matrix editing feature that permits the easy entry and manipulation of matrices. We tried replacing one of the elements in a real four by four matrix with the variable "x" before instructing the calculator to compute the inverse ..... this process took less than half a minute!
Forgotten formulae should no longer be a barrier to problem solving. Try asking the calculator to expand sin (a + b) and it responds with sina cosb + cosa sinb. It is this ability to work with generic functions and expressions that puts the TI-92 into a class of its own. In figure 1, for example, we see that when instructed to compute the arclength of a function with all parameters entered as variables the TI-92 returns the formula for the arclength of a function.
An investigation involving sound:
We are reliably informed that a tuning fork will produce a sound pattern that fits the mathematical modelThe microphone is connected to the CBL and the program (Sound) is used to digitise pressure changes (compressions and rarefactions) that are produced as a result of vibrating air molecules at the tip of the tuning fork. These values are then displayed as a scatter plot on the TI-92. As we see in figure 2 the horizontal measurement line is then switched on in order to measure the amplitude of this wave pattern. Returning to the home screen the value 0.008668 is stored into the variable location for the amplitude "a". A similar procedure is used to approximate the period of this plot; this is done by averaging out the measurement that is obtained for six periods. This value is then inverted to obtain the frequency of 270.47 which is in turn stored into the variable location for the frequency "f". Since we cannot be certain of the exact moment at which we commenced our measurements we can try placing a value of zero into the variable location for "p" before asking the calculator to sketch the graph of the this model over the original scatter plot. As you see from my example in figure 2 the mathematical model is very close to the real thing although it may be possible to improve this by adjusting the value of "p" even further.y = a sin {2fpi (x + p)} where "a" represents the amplitude of the fork, "f" represents its frequency and "p" represents any possible phase shift in the wave pattern. Reproduce the sound pattern of a tuning fork and use this to obtain measurements for each of the parameters stated above. Use these values to build a mathematical model of your own which may be used to comment on the validity of the theoretical model.
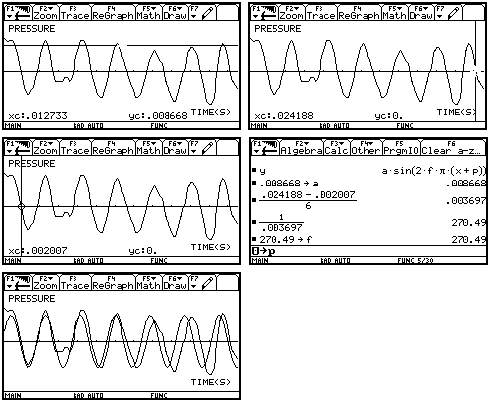
Figure 2: An investigation using the CBL
Example:
Construct the locus of the midpoints of all chords of a circle that have one common point on the circumference as an endpoint.The majority of the TI-92's applications first prompt the user to give their work a file name and locate it in an appropriate folder. To work on this particular problem we open the Geometry application and give the file name g1 to our work (figure 3).
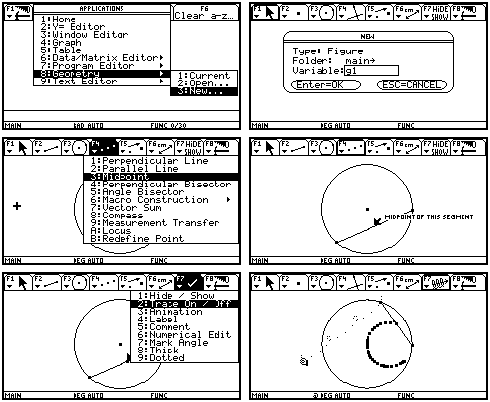
Figure 3: Performing traces and animation
The respective geometry tools are now used to construct a circle, a chord and a midpoint to the chord. Independent measurements are not required for finding the mid-point. Choosing the mid-point function from one of the menus the user simply points to the chord with the cursor pointer and presses the enter key (figure 3).
One of the more fascinating features of the TI-92 is its ability to trace and/or animate objects that have been constructed. This provides a powerful tool for illustrating both algebraic and geometrical relationships in real time thereby removing much of the tedium associated with illustrative work of this nature. The animate command combined with the drag/release hand feature commences the animation process while the trace command allows the process to be carried out one step at a time. The result is difficult to visualise (figure 3) and must be seen live to be appreciated. As the variable moves around the circumference the chord continually changes in length leaving behind a trace of the collection of midpoints. The animation process may be toggled on and off using the enter key.
What is the longest pole that will fit horizontally around the corner of a corridor whose width changes from 10 metres to 5 metres?
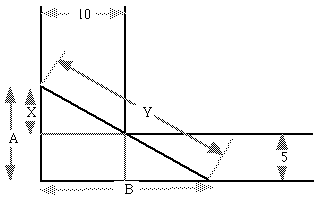
Figure 4: Construction for calculus problem
The required construction is given in figure 4. Conventional approaches to such a problem normally has the student spending a considerable proportion of his/her time finding important points such as stationary values, intercepts and extremes, in order to graph. A preferred approach might involve using the TI-92 to first graph the function and then to analyse its important features for an answer.
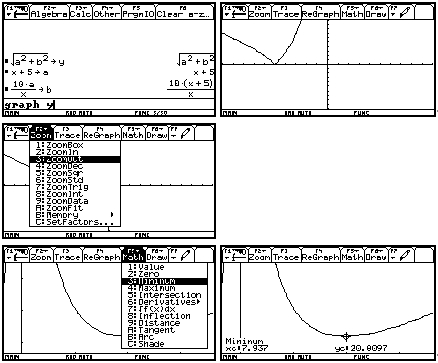
Figure 5: Solving the calculus problem
The required information is entered into the calculator (figure 5). Note that the TI-92 permits entry of data values into variable locations. This removes the need for the often-tedious algebraic manipulation that accompanies such problems. When asked to graph the function the TI internally evaluates y as a function of x only and displays the required graph. The problem of inappropriate scaling is easily addressed by zooming out the function to view any hidden sections of the graph. The function can then be boxed and enlarged before using the minimum command to compute the length of the pole as 20.8097 metres.
| Dr John Green, Faculty of Education, University of Southern Queensland PO Darling Heights, Toowoomba Qld 4350 greenj@usq.edu.au Please cite as: Green, J. (1998). The new generation graphing calculator and its application in the mathematics classroom. In C. McBeath and R. Atkinson (Eds), Planning for Progress, Partnership and Profit. Proceedings EdTech'98. Perth: Australian Society for Educational Technology. http://www.aset.org.au/confs/edtech98/pubs/articles/green.html |